We experiment with a variety of visual tools to promote conceptual understanding, strategic thinking, and effective communication. Explore additional drawings and visualizations.
Drawing and Visualization
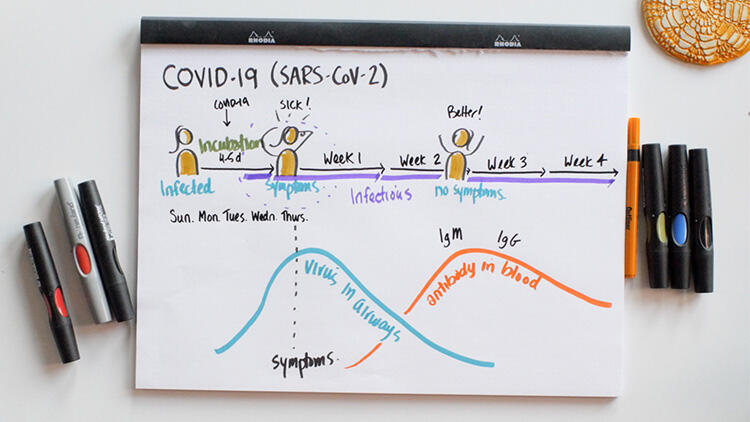
Claudia's COVID-19 (SARS-CoV-2) Diagnosis
In this drawing from a lesson in a series on Coronavirus, Professor Sue J. Goldie explores the narrative of “Claudia” who becomes infected with COVID-19. In the video, Professor Goldie sketches out the temporal relationship between infection, incubation and infectiousness, relating these to the development of symptoms in an individual and detection of virus using a diagnostic test. The development of Claudia’s story through an illustrated timeline helps students understand and retain the information while translating the testing data into a visual format aids interpretation. Watch an animation Professor Goldie created about Claudia’s diagnosis that further explores test characteristics.
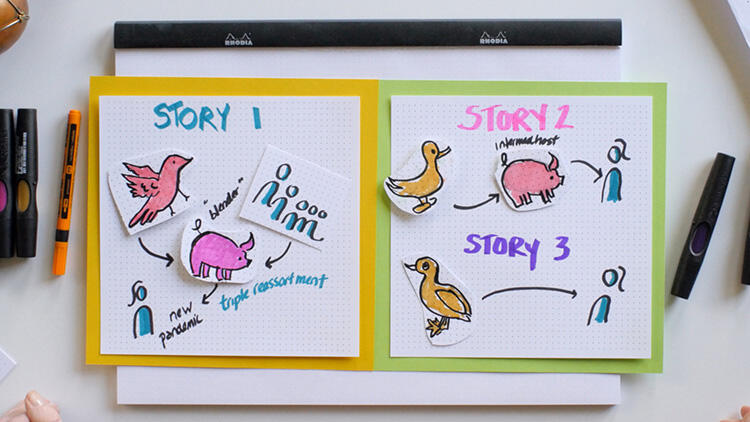
Antigenic Shift and Pandemic Potential
In part two of a video series on influenza viruses and pandemic risk, Professor Sue J. Goldie used these illustrative drawings while she explained the nature of genetic changes, both small adaptive mutations that correspond to new seasonal strains (antigenic drift) and more drastic changes that can lead to novel strains with pandemic potential (antigenic shift). Incorporating drawings as a way to scaffold lessons can be a powerful tool for educators. Likewise, learners can leverage visual notetaking to support personal retention and synthesis of material. Read our news story about the October virtual workshop on sketchnoting for graduate students led by the Incubator’s Instructional Designer, Nina Bhattacharya. Explore the Incubator’s Teaching Toolkit of resources for getting started on your own visualization in teaching and learning!